Abstract
This study conducted differentially expressed gene (DEG) analysis on three key tissues (brain, gonad, pectoral fins) of Japanese eel (Anguilla japonica) under seawater (SEA) and freshwater (TAP) conditions, to elucidate the transcriptomic response mechanisms during salinity adaptation.
Key findings:
- Global analysis (controlling for tissue effects) identified 422 DEGs (303 upregulated, 119 downregulated)
- The brain was the most salinity-sensitive tissue, with 500 DEGs identified
- Eight core response genes were significantly differentially expressed across all three tissues (intersection), all upregulated in the seawater environment
Main conclusions:
- Japanese eel exhibits tissue-specific transcriptomic responses to salinity changes, with the brain responding most strongly and the pectoral fins most conservatively.
- The seawater environment activated more genes (72% upregulated in global analysis), indicating that seawater salinity promotes specific gene expression programs.
- The divergent response patterns across tissues reflect differentiated adaptive strategies of tissue-specific functions to environmental salinity.
1. Materials and Methods
1.1 Sample Information
The experiment used non-wild farmed eels purchased in the Quanzhou area on May 31, 2017. At purchase, eels weighing 300–1000 g were selected, with a relatively stout body shape, rounded and blunt pectoral fins, dark coloration, and a black back with silver belly. These are typical characteristics of female silver eels preparing for seaward migration; morphological sex identification at this stage achieves approximately 90% accuracy1.
Three eels were randomly selected from five non-wild individuals for salinity acclimation, with the freshwater-reared eels serving as controls. Seawater salt was added daily at a rate of 6.6‰. By the fifth day, the experimental group reached a salinity of approximately 30‰ (full seawater salinity is about 35‰), simulating the salinity gradient experienced by Japanese eels during their seaward migration.
At sampling, all five Japanese eels were anesthetized in ice water, after which morphological measurements and dissection were performed. Brain, gonad, and pectoral fin tissues were collected from each eel as RNA sequencing samples. To prevent RNA hydrolysis, tissues were immediately frozen in liquid nitrogen for preservation.
| Sample | Body Length (mm) | Body Weight (g) | Horizontal Eye Diameter (mm) | Vertical Eye Diameter (mm) | Interorbital Distance (mm) | Snout Length (mm) | Pectoral Fin Length (mm) | Pectoral Fin Width (mm) | Anus to Pelvic Fin Origin (mm) |
|---|---|---|---|---|---|---|---|---|---|
| SEA_1 | 695 | 553 | 12 | 11 | 15 | 12 | 35 | 16 | 5 |
| SEA_2 | 650 | 570 | 10 | 9 | 13 | 13 | 30 | 20 | 4 |
| SEA_3 | 680 | 600 | 11 | 11 | 13 | 13 | 30 | 16 | 4 |
| TAP_1 | 675 | 610 | / | / | / | / | 30 | 20 | 8 |
| TAP_2 | 715 | 650 | 9 | 10 | 15 | 16 | 27 | 18 | 5 |
Notes:
- SEA_N: experimental group; TAP_N: control group;
- Body length: distance from snout tip to caudal fin base;
- Horizontal eye diameter: width from anterior to posterior orbital margin; vertical eye diameter: width from superior to inferior orbital margin;
- Interorbital distance: width between the centers of both eyes;
- Snout length: distance from anterior orbital margin to snout tip;
- Pectoral fin length: distance from pectoral fin base to tip.
This analysis included 15 samples across 3 tissues and 2 salinity treatments:
| Tissue | Seawater Group (SEA) | Freshwater Group (TAP) |
|---|---|---|
| Brain | BR_SEA_1, BR_SEA_2, BR_SEA_3 | BR_TAP_1, BR_TAP_2 |
| Gonad | GD_SEA_1, GD_SEA_2, GD_SEA_3 | GD_TAP_1, GD_TAP_2 |
| Pectoral fins | PF_SEA_1, PF_SEA_2, PF_SEA_3 | PF_TAP_1, PF_TAP_2 |
1.2 Data Preprocessing
This analysis was based on transcriptome sequencing data. De novo assembly using Trinity produced 16,920 putative genes. To reduce the influence of sequencing depth on the results, we filtered gene expression counts by removing genes with counts below 10 in at least 3 samples, ultimately retaining 16,866 genes for downstream differential expression analysis.
1.3 Statistical Analysis Methods
This analysis employed two design strategies (significance threshold: padj < 0.05):
| Feature | Global Analysis (Controlling for Tissue Effects) | Per-Tissue Analysis |
|---|---|---|
| Design formula | ~tissue + treatment | ~treatment |
| Sample scope | All 15 samples | 5 samples per tissue |
| Metadata | Includes tissue and treatment | Includes treatment only |
| Purpose | Detect consistent treatment effects across tissues | Detect tissue-specific treatment effects |
Global Analysis (Multi-Factor Model)
design = ~tissue + treatment
The global analysis used a multi-factor linear model to control for baseline differences between tissues and detect consistent treatment effects across tissues:
$$ log2(μ_ij) = β_0 + β_{tissue_j} + β_{treatment} · X_{treatment} $$Where:
- $β_0$: intercept (baseline expression level)
- $β_{tissue_j}$: tissue effect — baseline expression differences among different tissues (brain, gonad, pectoral fins)
- $β_{treatment}$: treatment effect — the expression change of SEA vs. TAP after controlling for tissue differences
Including tissue as a covariate in the model means:
- The model first removes the baseline expression differences inherent to different tissues
- It then estimates a unified treatment effect (applicable to all tissues)
- It assumes the treatment effect is identical across tissues
Per-Tissue Analysis (Single-Factor Model)
design = ~treatment
Seawater vs. freshwater differential expression was tested independently within each tissue.
Wald Test
The Wald test evaluates whether a coefficient in the model (e.g., the treatment condition effect) is significantly non-zero. In RNA-seq differential expression analysis, the commonly used negative binomial model fits the following for each gene:
$$ \log(\mu_{ij}) = \beta_0 + \beta_1 X_{condition} + \beta_2 X_{tissue} + \dots $$The Wald test examines whether $\beta_1$ (the treatment condition effect) is significant, and is suitable for scenarios with small sample sizes but relatively stable model fitting.
Benjamini-Hochberg (BH) Correction
RNA-seq data typically contain thousands of genes, each producing a p-value. Using raw p-values directly leads to a large number of false positives (Type I error). The BH method controls the false discovery rate (FDR) — the expected proportion of false positives among all genes declared significant. For multiple testing problems (e.g., 20,000 genes), FDR control is more lenient and more reasonable than Bonferroni correction, preserving more potential biological signals. BH correction makes no special assumptions about the distribution of p-values, making it suitable for handling large-scale multiple testing of genes, even when individual gene sample sizes are small.
2. Results
2.1 Overview of Differentially Expressed Genes
Global Analysis Results (Controlling for Tissue Effects)
| Metric | Value |
|---|---|
| Total DEGs | 422 |
| Upregulated (SEA > TAP) | 303 |
| Downregulated (SEA < TAP) | 119 |
| Up/Down Ratio | 2.55 |
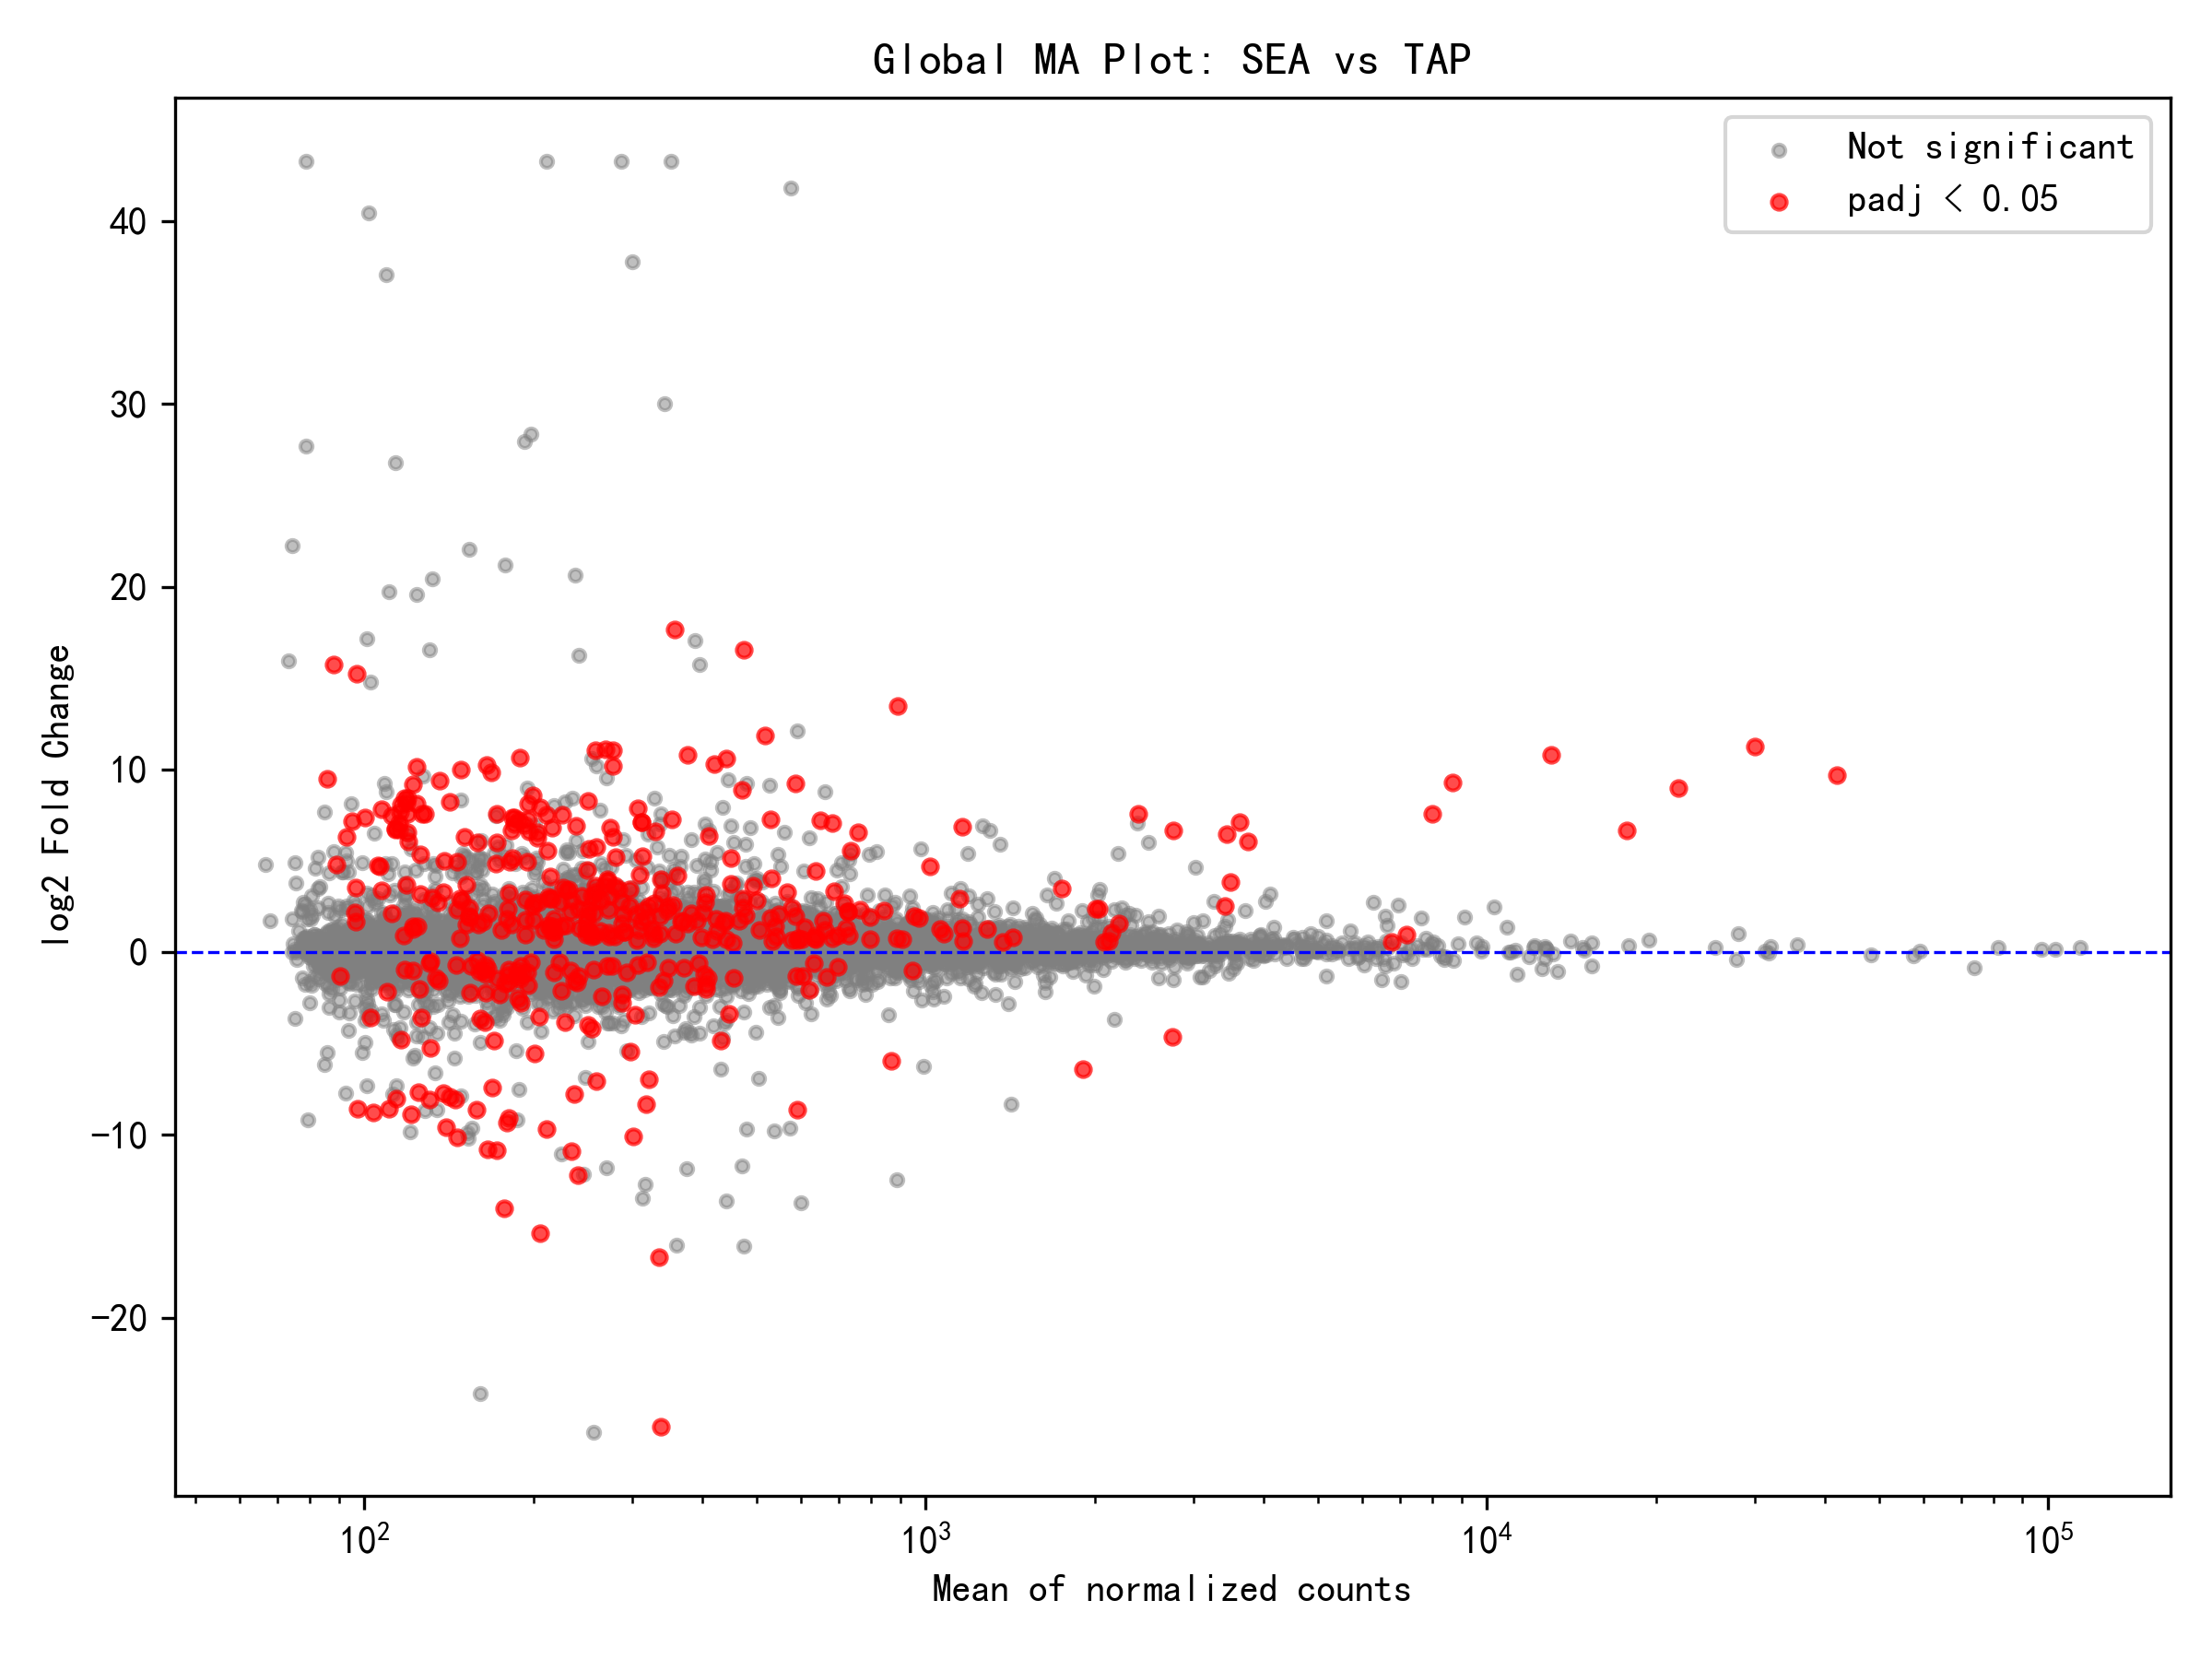
From the overall differential expression results, the global analysis (controlling for tissue effects) identified 422 DEGs among 16,866 effective genes, with 303 genes upregulated and 119 downregulated in the seawater environment — upregulated genes accounting for 72%. This result indicates that the Japanese eel's response to seawater salinity primarily involves activation rather than suppression of gene expression. The up/down ratio of 2.55 suggests that the seawater environment triggered a more active gene expression program, likely closely related to adaptive mechanisms such as osmoregulation, ion transport, and energy metabolism.
Per-Tissue Analysis Results
| Tissue | Total DEGs | Upregulated | Downregulated | Up/Down Ratio |
|---|---|---|---|---|
| Brain | 500 | 340 | 160 | 2.13 |
| Gonad | 131 | 75 | 56 | 1.34 |
| Pectoral fins | 97 | 82 | 15 | 5.47 |
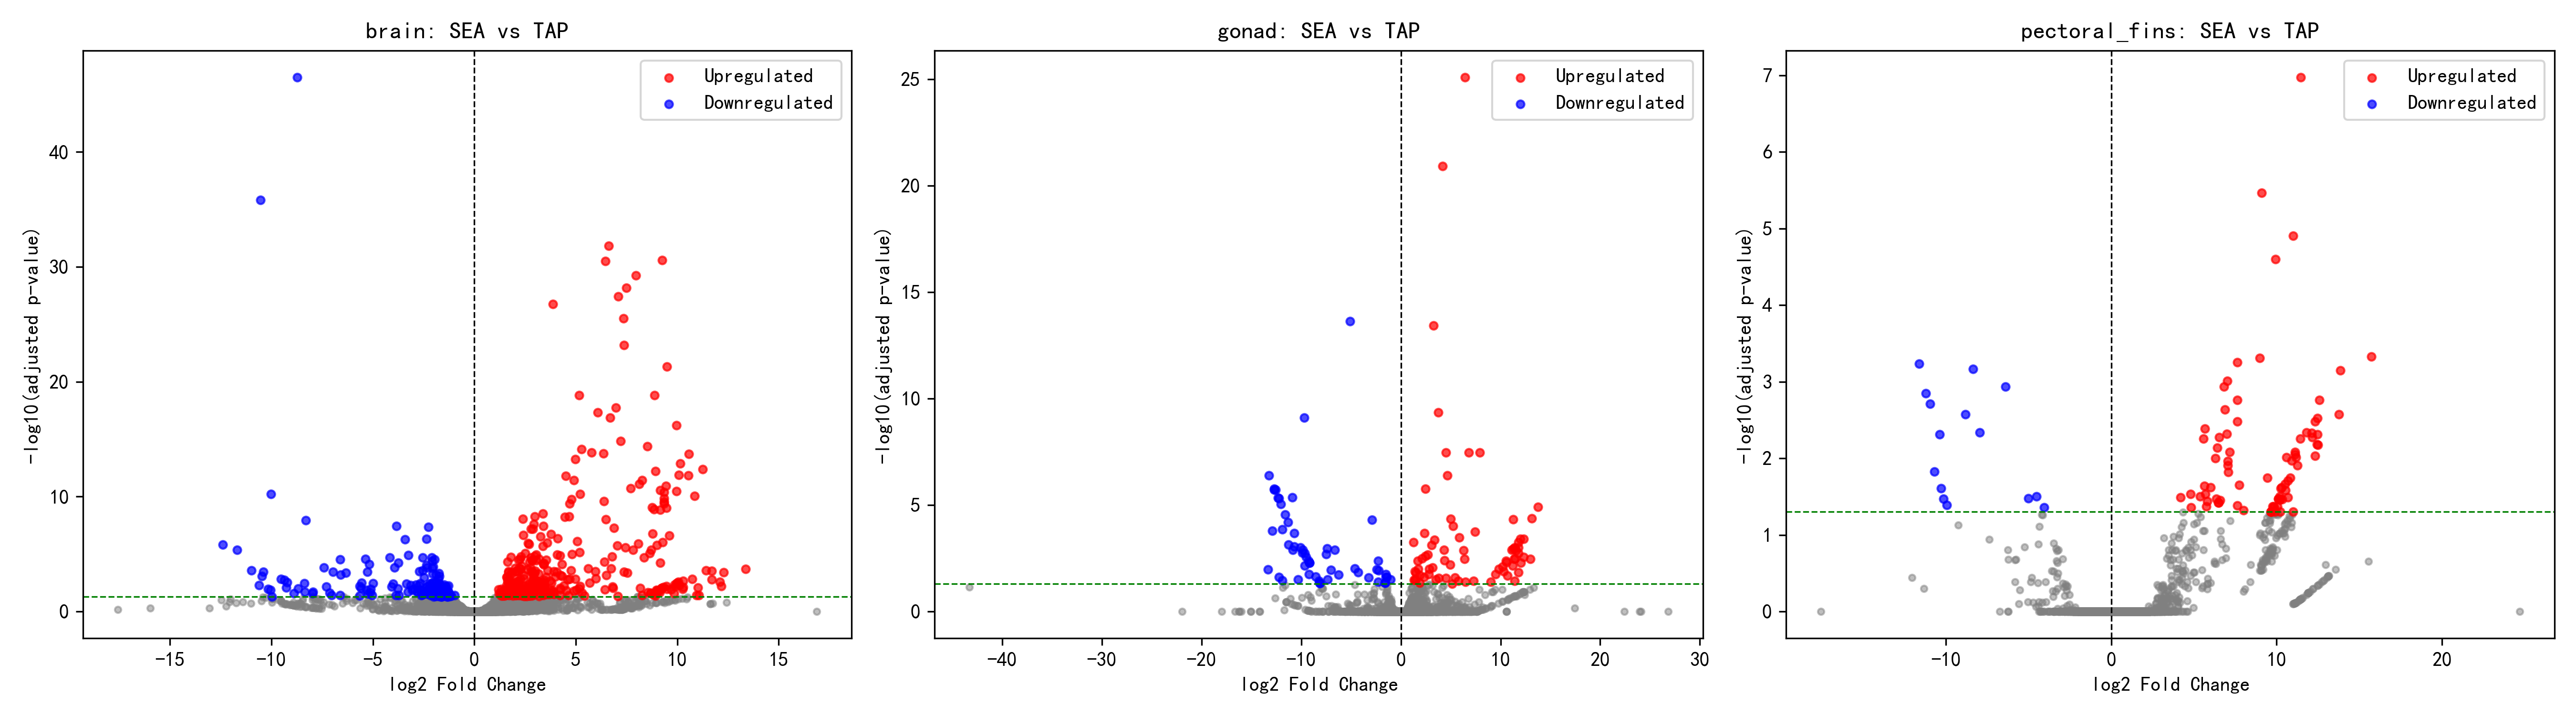
In the per-tissue analysis, the three tissues showed markedly different response patterns. The most DEGs were found in the brain (500), with 340 upregulated and 160 downregulated, yielding an up/down ratio of 2.13, indicating that the brain is the most sensitive to salinity changes — consistent with its central role in neuroendocrine regulation of osmoregulatory adaptation. The gonad had 131 DEGs, with 75 upregulated and 56 downregulated, giving an up/down ratio of 1.34, the closest to 1:1 among the three tissues, suggesting a relatively balanced gonadal response to salinity changes that may involve coordinated adjustments of metabolic and reproductive functions. The pectoral fins had the fewest DEGs (97), but the highest up/down ratio of 5.47 (82 upregulated, 15 downregulated), displaying a strong unidirectional response pattern that suggests a small number of genes in the pectoral fins are strongly activated by the seawater environment, possibly encoding functional proteins directly involved in osmoregulation.
2.2 Tissue-Specific Response Analysis
Brain — The Most Sensitive Salinity-Responsive Tissue
The brain exhibited the strongest salinity response, with DEG numbers (500) far exceeding those of other tissues. This finding suggests:
- Neuroregulatory mechanisms may play a central role in salinity adaptation
- The brain may coordinate systemic salinity adaptation responses by regulating osmoreceptors and neuroendocrine pathways
- The high proportion of upregulated genes (340/500 = 68%) indicates that the seawater environment activates a broad gene expression program in the brain
Gonad — Moderate Salinity Response
The gonad's DEG count (131) falls between the brain and pectoral fins, and its up/down ratio (1.34) is also close to 1:1. This may reflect:
- Reproductive organs exhibit a certain degree of response to environmental salinity changes
- The seawater environment may affect gonadal metabolism and maturation processes
- Sex-specific reproductive strategies may involve adaptive regulation to salinity
Pectoral Fins — Conservative Salinity Response
The pectoral fins had the fewest DEGs (97) but the highest up/down ratio (5.47), indicating:
- The transcriptional response of pectoral fins to salinity changes is relatively conservative
- A small number of genes are strongly activated in the seawater environment
- These genes may encode proteins directly related to salinity adaptation (e.g., ion channels, osmoregulatory proteins)
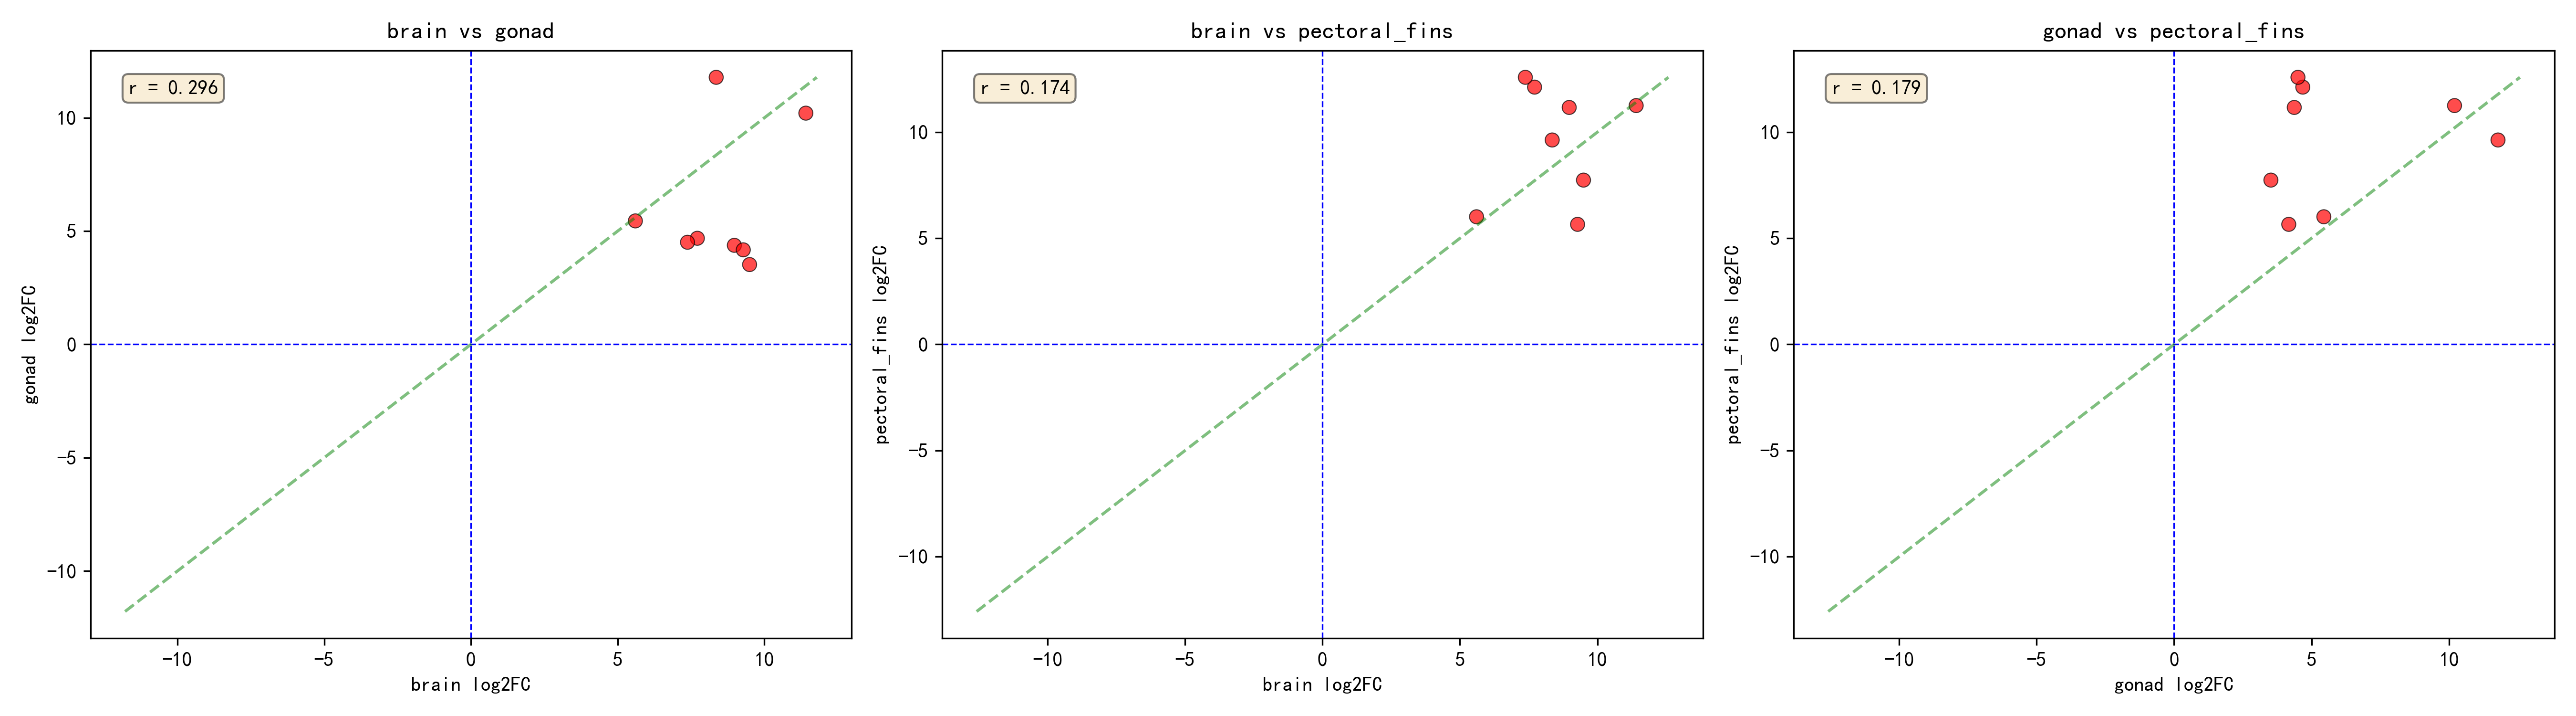
2.3 Core Response Genes (Significant Across All Three Tissues)
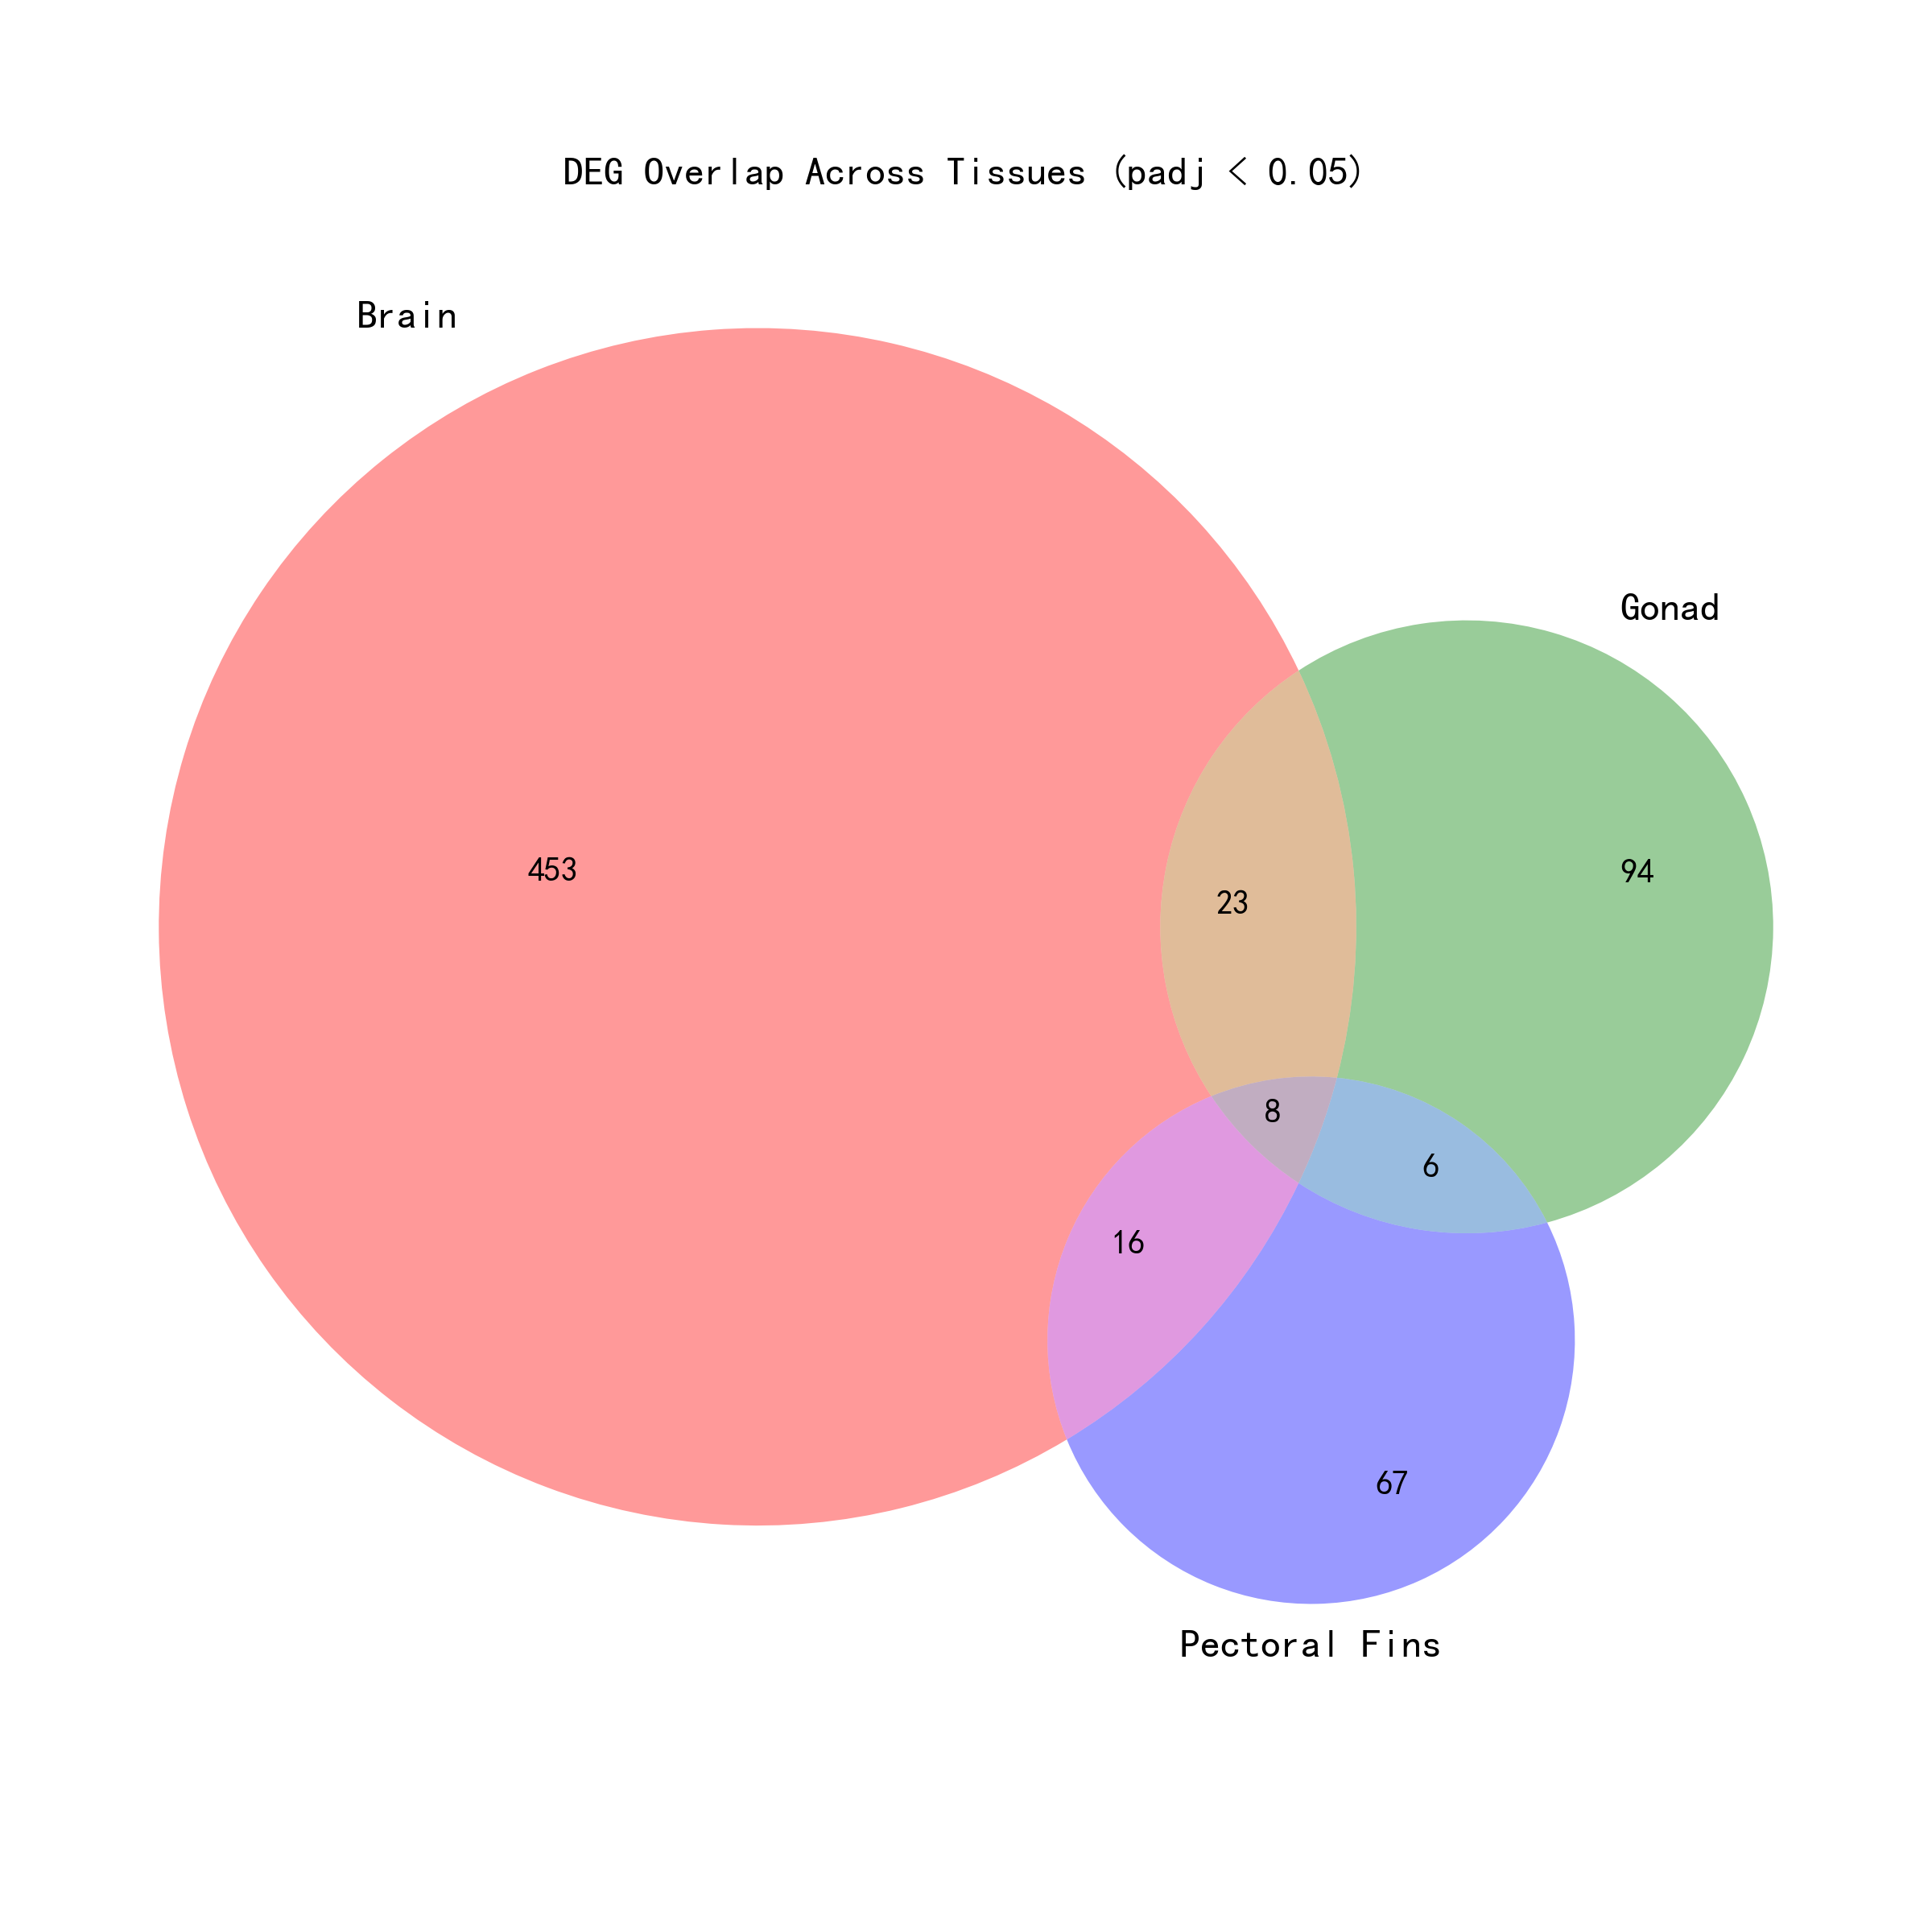
By intersecting the per-tissue analysis results, 8 core DEGs were identified — genes showing significant salinity response across all three tissues (padj < 0.05):
| Gene ID | Brain log2FC | Gonad log2FC | Pectoral Fins log2FC | Mean log2FC |
|---|---|---|---|---|
| _TRINITY_DN215578_c8_g2_i4 | 11.41 | 10.20 | 11.25 | 10.95 |
| _TRINITY_DN212746_c1_g3_i1 | 8.36 | 11.78 | 9.63 | 9.92 |
| _TRINITY_DN196393_c2_g1_i4 | 7.71 | 4.68 | 12.12 | 8.17 |
| _TRINITY_DN210877_c3_g1_i17 | 8.97 | 4.37 | 11.16 | 8.17 |
| _TRINITY_DN192233_c0_g2_i2 | 7.38 | 4.51 | 12.58 | 8.16 |
| _TRINITY_DN193247_c3_g1_i5 | 9.49 | 3.52 | 7.74 | 6.92 |
| _TRINITY_DN220510_c3_g1_i1 | 9.28 | 4.17 | 5.66 | 6.37 |
| _TRINITY_DN192231_c4_g1_i1 | 5.60 | 5.45 | 6.01 | 5.69 |
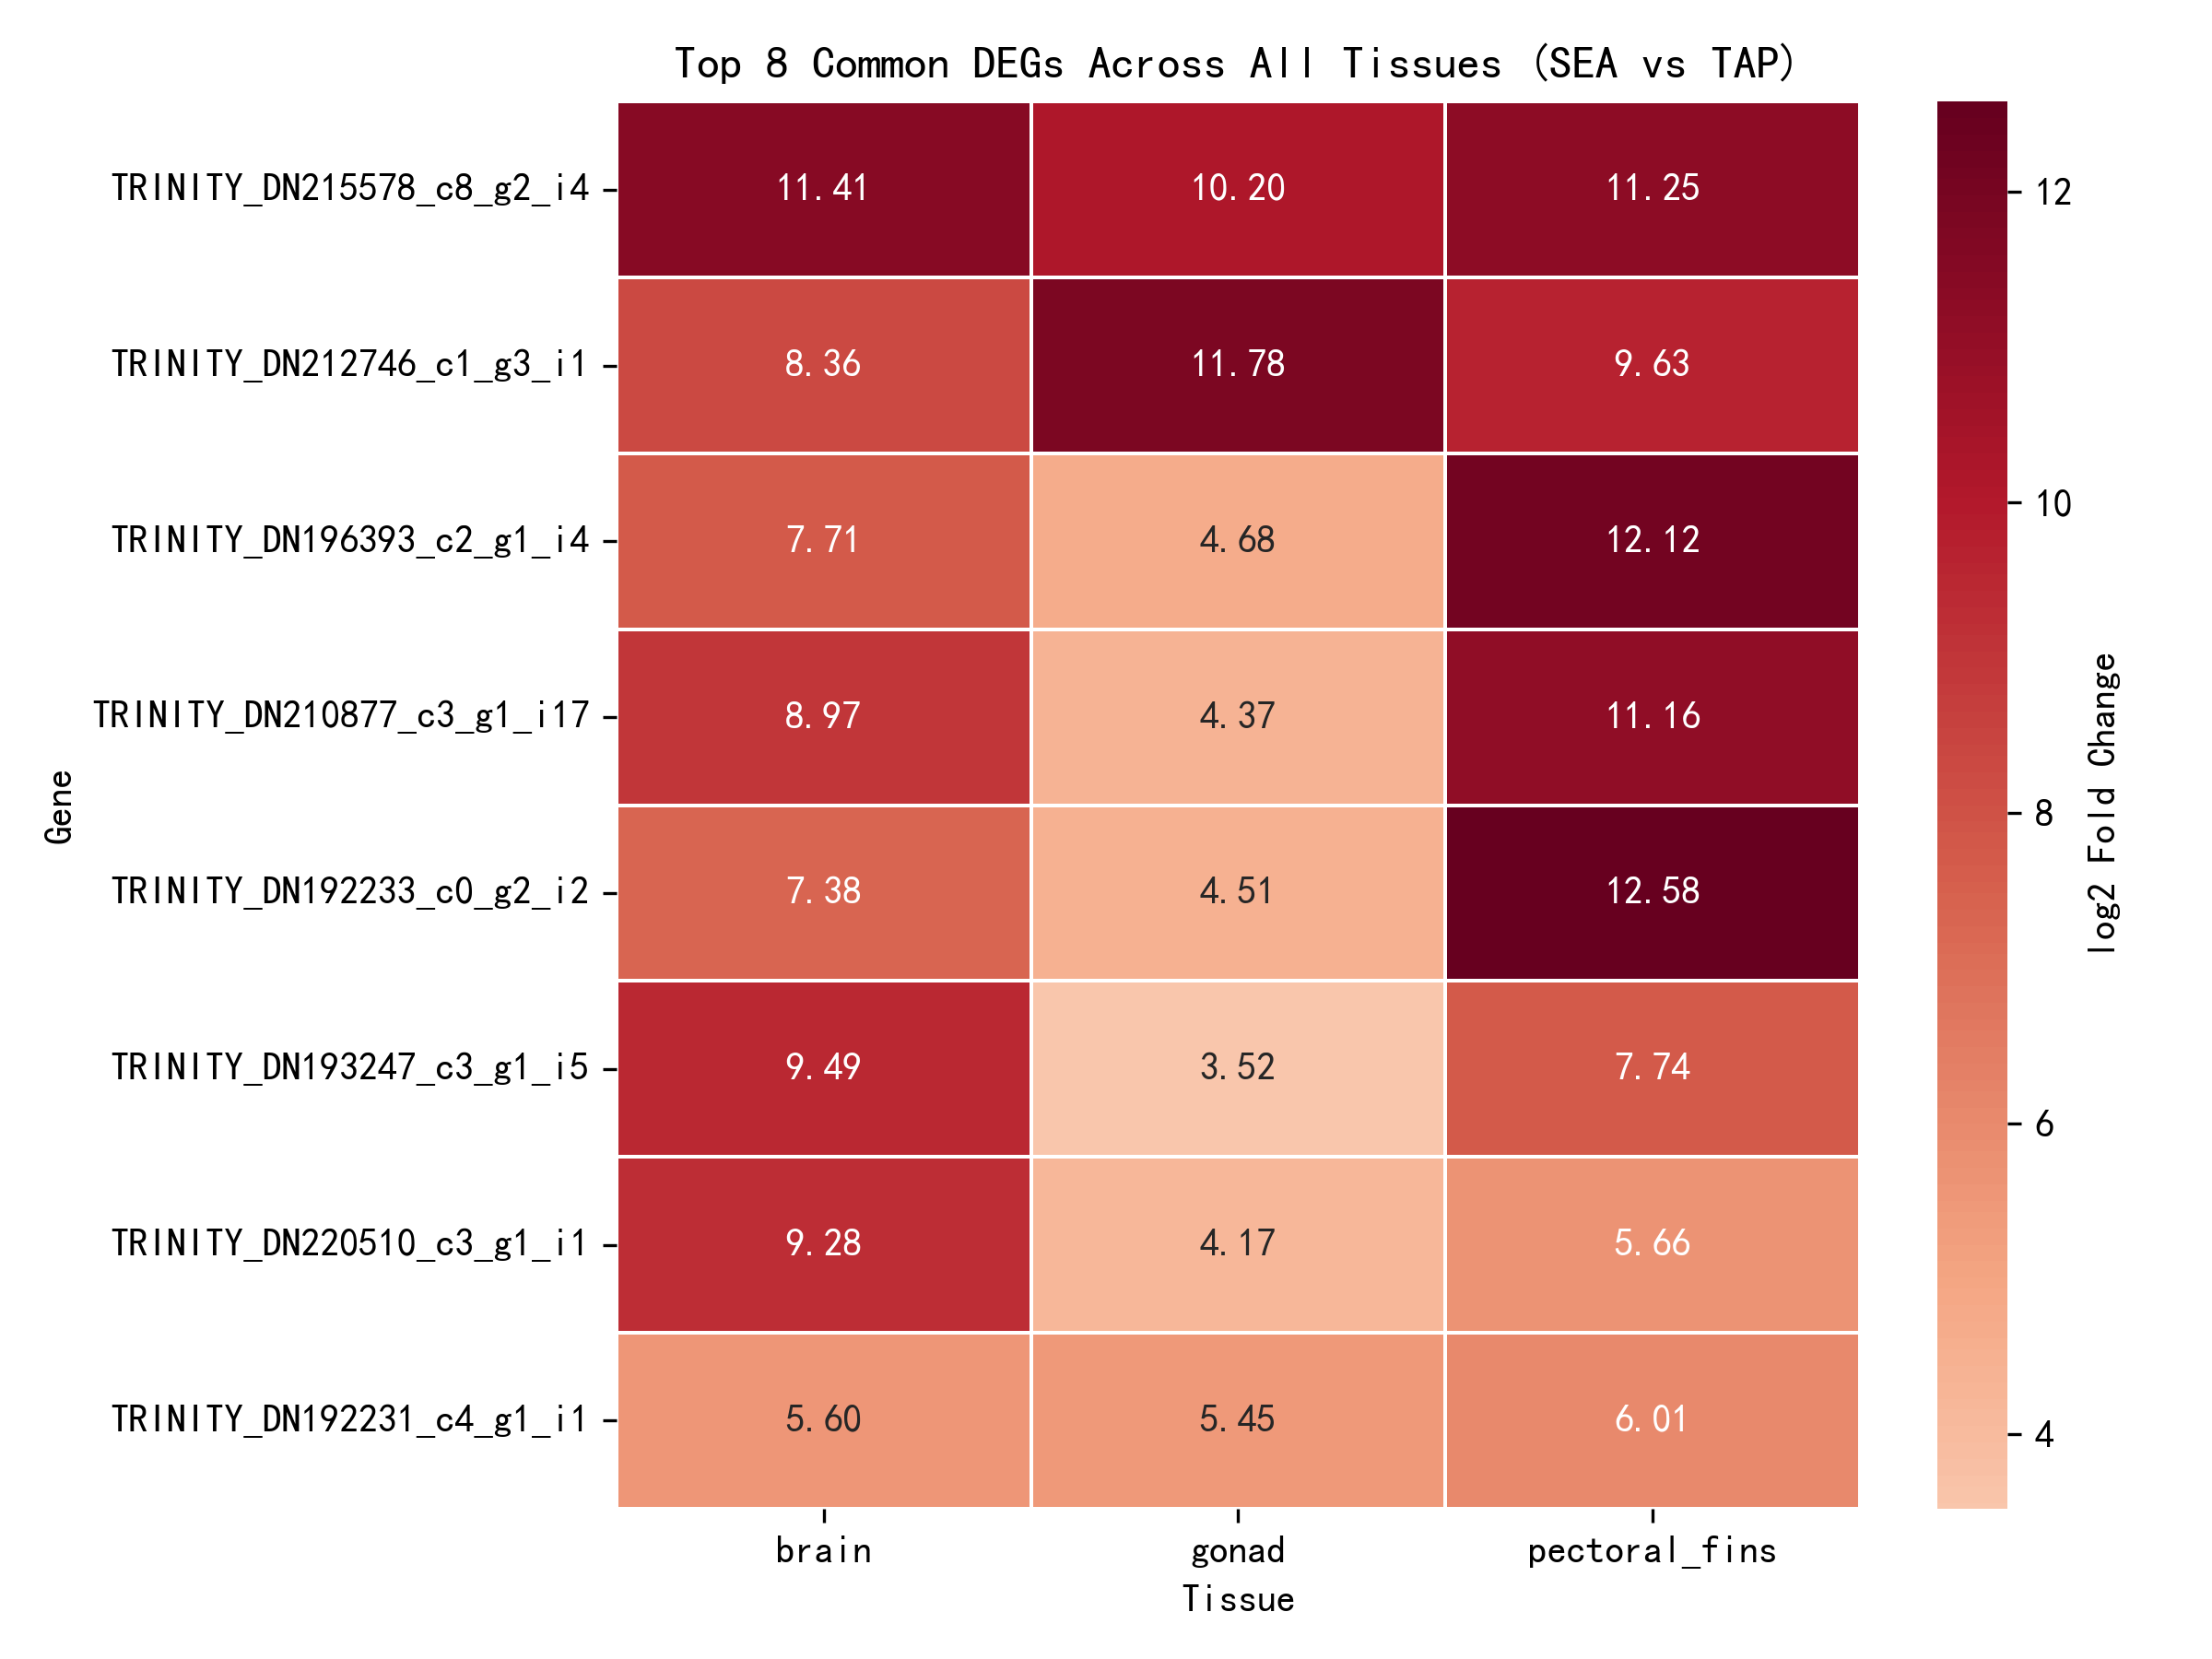
All 8 core response genes were upregulated (log2FC > 0), indicating enhanced expression in the seawater environment and suggesting their involvement in the core salinity adaptation mechanisms of the eel.
2.4 Cross-Validation Between Global and Per-Tissue Analyses
To comprehensively understand the relationship between the two analysis strategies, cross-validation statistics were computed:
| Category | Gene Count |
|---|---|
| Globally significant | 422 |
| Significant in all three tissues (Brain+Gonad+Pectoral fins) | 8 |
| Significant in all three tissues but not globally significant | 0 |
| Globally significant but not significant in all three tissues | 414 |
Further classification of the 414 genes that were globally significant but not significant in all three tissues:
| Number of Significant Tissues | Gene Count | Details |
|---|---|---|
| 0 tissues significant | 226 | Not significant in any per-tissue analysis |
| 1 tissue significant | 148 | 104 (brain only), 31 (gonad only), 13 (pectoral fins only) |
| 2 tissues significant | 40 | Significant in two tissues but not all three |
All 8 genes significant across all three tissues were also significant in the global analysis. A large number of genes were globally significant but not significant across all three tissues — 414 genes in total, accounting for 98% (414/422) of globally significant genes. Particularly noteworthy are the 226 genes that were not significant in any per-tissue analysis but were significant in the global analysis — these genes likely gained statistical power through the global analysis's cross-tissue integration, enabling detection of genes with weak but directionally consistent effects within individual tissues.
3. Conclusions and Discussion
This study employed a combined strategy of global analysis and per-tissue analysis to systematically examine DEGs in three key tissues of Japanese eel under seawater and freshwater conditions. The global analysis, controlling for tissue effects, identified 422 DEGs, with 303 upregulated and 119 downregulated. The per-tissue analysis revealed that the brain responded most strongly (500 DEGs), followed by the gonad (131 DEGs), with the pectoral fins being the most conservative (97 DEGs). Cross-validation identified 8 core response genes consistently upregulated across all three tissues, as well as 226 hidden response genes that were significant only in the global analysis but not in any per-tissue analysis.
The global analysis incorporated tissue as a covariate in the model, detecting consistent treatment effects across tissues after controlling for baseline tissue differences, and leveraging the larger sample size (n=15) to achieve higher statistical power. The per-tissue analysis independently tested within each tissue, allowing different response patterns across tissues, and obtained more stringent results through three independent corrections and intersection. Cross-validation of the two strategies revealed 414 genes (98% of globally significant genes) that were globally significant but not significant across all three tissues. Among these, 226 genes were not significant in any per-tissue analysis and were detected only in the global analysis — these genes had directionally consistent treatment effects but weak effect sizes in individual tissues, and the global analysis improved statistical power through cross-tissue integration. A further 148 genes were significant in only a single tissue (104 in brain, 31 in gonad, 13 in pectoral fins), and 40 genes were significant in two tissues. A typical scenario is a gene changing strongly in the brain (e.g., log2FC=4) but weakly in the gonad and pectoral fins (e.g., log2FC=0.5): the global model detected the significant effect using the larger sample size, but the per-tissue analysis failed to reach significance due to small sample size (n=5).
The 8 core response genes, consistently significant in both the per-tissue and global analyses, had log2FC values greater than 5 in all tissues, indicating an extremely strong response to salinity changes. Notably, this study found no cases where genes were significant across all three tissues but not significant in the global analysis. Such cases are rare but possible — for example, when effect directions oppose each other across tissues (up in brain, down in gonad, up in pectoral fins), the effects would cancel out in the global model. This suggests that tissue-specific responses in eel salinity adaptation primarily manifest as differences in effect magnitude rather than opposing directions. The 8 core response genes showed not only consistent effect directions but also sufficiently strong effects in each tissue to be detected by both analysis strategies, representing the most robust salinity-responsive genes and warranting further functional investigation.
Among all genes significant in the per-tissue analyses, brain-specific significant genes were the most numerous (104), and the brain contributed the vast majority of the 414 globally significant but not universally significant genes. This aligns with the brain's function as an osmoreceptor and neuroendocrine regulatory center, suggesting that the brain plays a dominant role in salinity sensing and coordinating systemic adaptive responses. The global analysis was able to detect genes with weak but directionally consistent effects within individual tissues; these 226 hidden response genes may involve fundamental cellular osmoregulatory mechanisms, such as ubiquitous ion channels and osmotic response elements, forming an indispensable basal regulatory network for salinity adaptation.
In the salinity adaptation process, we observed changes in lipid metabolism-related genes in the gonadal tissue of Japanese eel. Functional annotation of TRINITY_DN187689_c0_g1_i9 revealed that the latter half of this putative gene shares similar nucleotide sequences with multiple transcript variants of the Plin2 (Perilipin 2) gene in the Asian arowana (Scleropages formosus), with increased RNA expression (p-value = 0.0027, but not significant after correction: padj = 0.2023). TRINITY_DN192327_c4_g3_i14 is a gene similar to that encoding sphingomyelin synthase 1 (Sgms1) in the Asian arowana, and its RNA expression decreased after transfer to seawater.
Perilipin 2 is an adipose differentiation-related protein, originally named ADRP2. Increased transcription of this gene is an early sign of adipocyte differentiation, though not essential — adipogenesis proceeds normally even after Plin2 knockout3. It is known that Plin2 exhibits high affinity for sphingomyelin (SM) and phosphatidylcholine (PC)4, but its function remains unclear; it appears to provide a protective barrier for lipidated proteins, promoting lipid deposition and reducing triacylglycerol turnover5'6.
Lipid synthesis, differentiation, and deposition are closely tied to gonadal development in Japanese eel. According to Zhang Jieming et al.'s staging and description of ovarian development in Japanese eel, during the developmental adaptation phase, oocytes begin to develop one or more layers of lipid droplets; upon entering the developmental initiation phase, the lipid droplet layer thickens further and becomes more densely arranged; it reaches maximum thickness during the growth phase, then begins to thin and loosen7. Once Japanese eels begin their migration, they cease feeding entirely; body energy and further gonadal development both depend on lipid utilization, and lipid mobilization from muscle tissue provides the material basis for ovarian development8. Phospholipid metabolism in muscle tissue generally proceeds through three pathways: (1) digestion by phospholipases released from lysosomes; (2) hydrolysis by carnosine dipeptidase to form sphingomyelin; (3) synthesis of phosphatidylcholine9. We hypothesize that during the seaward migration, Plin2 RNA expression increases and Sgms1 is shut down in Japanese eel because lipids mobilized to the ovary are neither digested by phospholipases nor converted to sphingomyelin, but instead begin to deposit during the developmental adaptation phase, preparing the substantial phosphatidylcholine reserves required for egg production.
4. Study Limitations and Outlook
This study has the following limitations: first, the small sample size (3 in the SEA group, 2 in the TAP group) limited statistical power, and some genes with moderate effect sizes may have gone undetected; second, the experiment used a gradual salinity acclimation protocol, which may differ from the salinity changes experienced by eels during natural seaward migration; third, this study was conducted at the transcriptomic level, and subsequent work requires validation of key gene expression changes through qPCR, Western blot, and other experimental approaches, along with functional experiments (e.g., gene knockout/overexpression) to elucidate their specific roles in salinity adaptation.
Additionally, systematic functional annotation has been completed for the 8 core response genes identified in this study. These genes exhibit highly consistent expression patterns under seawater and freshwater conditions, suggesting their involvement in the core regulatory pathways of eel salinity adaptation and holding significant biological research value. However, since the analysis of the regulatory networks of these genes is still in progress and the related findings have not yet been compiled and publicly released, this paper presents only preliminary functional annotation results. How these core response genes coordinately regulate key physiological processes such as osmotic balance, ion transport, and energy metabolism still requires further elucidation through integration of protein interactomics, metabolomics, and functional validation experiments. Future research will focus on resolving the upstream and downstream regulatory relationships of these genes during salinity adaptation, with the aim of constructing a complete regulatory network for salinity response in Japanese eel and providing a theoretical basis for understanding the molecular mechanisms of eel migration.
Guo H Y, Wei K, Xie Z L, et al. Morphological index system and sex identification of silver eels from the Yangtze River Estuary[J]. Journal of Fisheries of China, 2011, 35(1): 1-9. ↩︎
BRASAEMLE D L, BARBER T, WOLINS N E, et al. Adipose differentiation-related protein is an ubiquitously expressed lipid storage droplet-associated protein[J]. Journal of Lipid Research, 1997, 38(11):2249-2263. ↩︎
CHANG H J, LAN L, PAUL A, et al. Protection against Fatty Liver but Normal Adipogenesis in Mice Lacking Adipose Differentiation-Related Protein[J]. Molecular & Cellular Biology, 2006, 26(3):1063-1076. ↩︎
MCINTOSH A L, STOREY S M, ATSHAVES B P. Intracellular lipid droplets contain dynamic pools of sphingomyelin: ADRP binds phospholipids with high affinity[J]. Lipids, 2010, 45(6):465-477. ↩︎
LISTENBERGER L L, OSTERMEYER-FAY A G, GOLDBERG E B, et al. Adipocyte differentiation-related protein reduces the lipid droplet association of adipose triglyceride lipase and slows triacylglycerol turnover[J]. Journal of Lipid Research, 2007, 14(12):2751-2761. ↩︎
STRACKE F, MA H, THIEL E. Singlet molecular oxygen photosensitized by Rhodamine dyes: correlation with photophysical properties of the sensitizers[J]. Journal of Photochemistry & Photobiology A Chemistry, 1999, 126(1–3):51-58. ↩︎
Zhang J M, Liu L, Guo F, et al. Histological study on artificially induced gonadal development of Japanese eel[J]. Journal of Fishery Sciences of China, 2007, 14(4): 593-601. ↩︎
Zhang L H, Zhang W M, Lin H R, et al. Mobilization of calcium and lipid during gonadal development induced by sex steroid hormones in female Japanese eel[J]. Acta Scientiarum Naturalium Universitatis Sunyatseni, 2002, 40(2):86-88. ↩︎
SPENCE M W, CLARKE J T, COOK H W. Pathways of sphingomyelin metabolism in cultured fibroblasts from normal and sphingomyelin lipidosis subjects[J]. Journal of Biological Chemistry, 1983, 258(14):8595. ↩︎